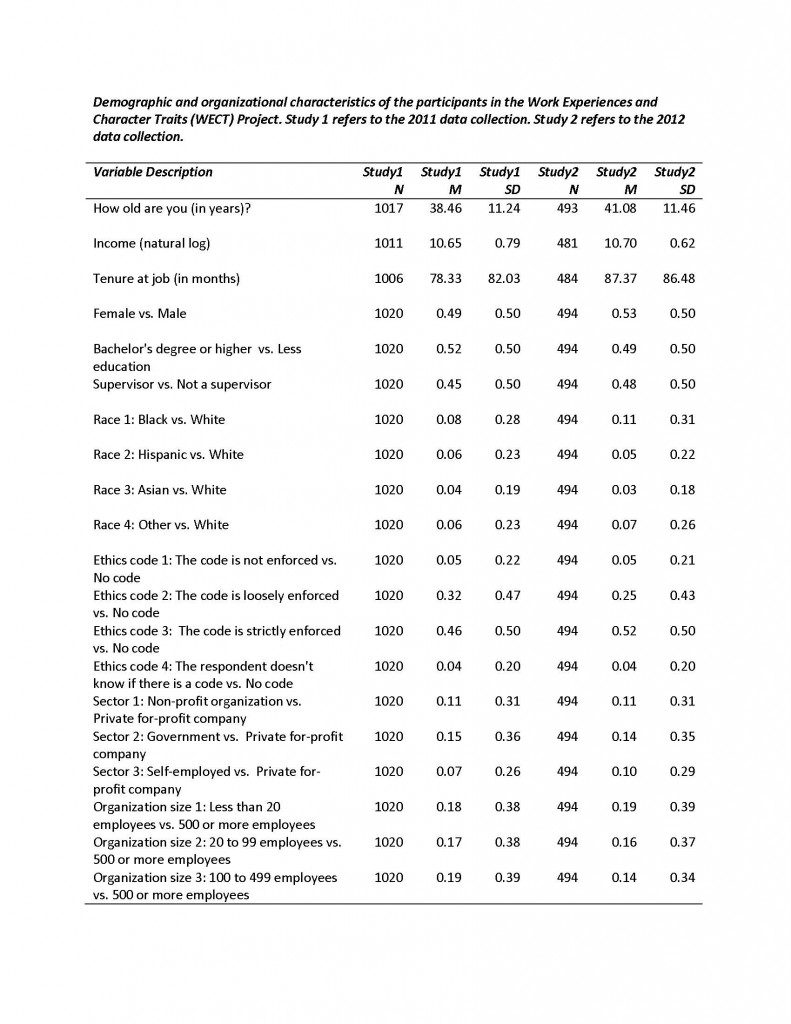
Demographic and Organizational Characteristics
Information about demographic and organizational characteristics was collected in the initial survey. In many analyses with the WECT data, we use these variables as controls. This document provides detailed information about these variables and how they were scored.
Gender, Age, Race. We included gender (0 = male, 1 = female); age in years; and race. Race is analyzed with four dummy-coded variables, which compare Black, Hispanic, Asian, and multiracial/other participants to White participants.
Education. Participants were asked to indicate the highest level of education that they completed by selecting a category from a list of seven, anchored by “Less than High School” and “Doctoral or Professional Degree (PhD, MD, JD, etc.).” We created a dummy-coded education variable for the statistical analyses, which compared participants with a four-year college degree (Bachelor’s degree) or more (1) to those with less than a four-year degree (0).
Income. Income was measured with an open-ended question asking participants to indicate their current yearly income in U.S. dollars, including bonuses and commissions. Given the large range (Study 1 = $0 to $750,000; Study 2 = $2,000 to $260,000), and skew (Study 1 skew = 7.51, skew SE = 0.08; Study 2 skew = 2.38, skew SE = 0.11), we computed the natural log of income plus one and used this variable in our statistical analyses.
We carefully examined the responses to the income question prior to analyzing the data, and used the responses from the job descriptions and other work-related items in the survey to help inform our judgments about questionable data. We made corrections when the error and correct response were clear (i.e., when there was an obvious typographical error); when the error and correct response were unclear, we marked the participant’s income as missing. In Study 2, we added an item to the final survey that helped us validate the responses from the initial survey. This item was a forced-choice question that provided participants with 17 income brackets, anchored by “$0” and “$150,000 or more.” We included this validation item because some of the responses to the open-ended income item contained errors. For instance, one participant in Study 2 reported an income of “$75,0000” in the initial survey, which should have been “75,000” given the misplaced comma and the job description of “teacher.” In the final survey, this participant selected the option “$70,000-$79,000”, confirming our assumption that the initial response contained a typographical error. We were conservative about changes and exclusions, and only changed or marked data as missing when we were confident that the response provided was faulty. For example, in Study 1, a participant indicated that her income was “$750,000,” which at first seemed suspect given that participants who complete online surveys do not tend to be particularly wealthy. However, her job description indicated that she was self-employed as a “private practice doctor” and her job duties were to “see patients and manage staff.” Given the consistency of her responses and that it is indeed plausible that a doctor could earn $750,000, we retained her income data despite it being an outlier.
Ethics code. The presence and enforcement of an ethics code in the organization was assessed with a multiple choice item that asked participants whether their organization had a formal code of conduct emphasizing ethical behavior. They could select one of five response options: (1) No, there is no formal ethics code; (2) Yes but the code is not enforced; (3) Yes, the code is loosely enforced; (4) Yes, the code is strictly enforced; (5) I don’t know. For statistical analyses, we created four dummy-coded variables that compared each option to the reference category, “No, there is no formal ethics code.”
Employment sector. The sector in which participants worked was assessed with a multiple-choice item adapted from the United States Census Bureau’s American Community Survey (http://www.census.gov/acs/www). Participants were asked, “Which of the following responses best describes your current job activity or business?” The eight response options were: (1) an employee of a private for-profit company or business, or of an individual, for wages, salary, or commissions; (2) an employee of a private not-for-profit, tax-exempt, or charitable organization; (3) a local government employee (city, county, etc.); (4) a state government employee; (5) a Federal government employee; (6) self-employed in own not incorporated business, professional practice, or farm; (7) self-employed in own incorporated business, professional practice, or farm; (8) working without pay in family business or farm. We created three dummy codes that compared the non-profit, government, and self-employed sectors to the private for-profit sector.
Organization size. Organization size was assessed by asking participants to indicate the size of their organization (including themselves) by selecting an option from a drop-down menu of 14 categories, anchored by “1 to 4 employees” and “10,000 employees or more.” We created three dummy-coded variables: less than 20 employees, 20 to 99 employees, and 100 to 499 employees. The category 500 or more employees was selected as the reference group because small businesses are those that contain less than 500 employees.
Tenure at the job. Tenure was assessed with an open-ended question asking participants when they started in their current position (in month/day/year format). We calculated their tenure at the job (in months) by subtracting the survey start date from the job start date.
Supervisor. Participants were asked (in an open-ended question), “How many people do you supervise in your organization? Write the number of employees that report to you.” We created a dummy-coded variable comparing participants who did not supervise anyone (no direct reports = 0) to employees who supervised one or more employees (one or more direct reports = 1).

